


Big Market Days
Friday 18th November 2022
Katy Baxter
When we’ve had a year in markets like 2022, it can be tough to work out how normal/abnormal it has been – or how we should be feeling.
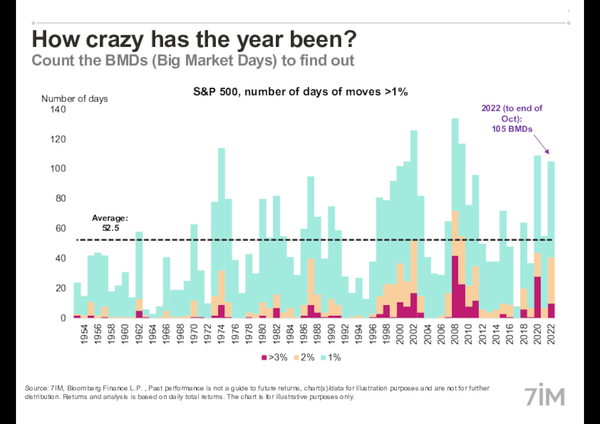
One way is to count how many days there have been where the market moved – up or down – by more than 1%. We can call these BMDs (Big Market Days) for lack of a better phrase.
The chart shows that count of days. Also highlighted in orange are those days where the move was more than 2%, and red those days where it was more than 3%. (This uses the US equity market because the data is more easily available)
Back to the question: “how abnormal has it been?”
So far this year we’ve had 105 BMDs. How does that stack up (bearing in mind we’ve still got two months to go)?
• 2022 definitely isn’t normal. The long term AVERAGE is 52.5 BMDs, so 2022 has already been twice as crazy as average.
• This has been the sixth “craziest” year since 1953. The others were 2020, 2009, 2008, 2002 and 1974.
• This is similar to COVID. In 2020 there were 109 BMDs. Although we should note that in 2020 there were 10 days where the market moved more than 5% (!), and we’ve had none of those so far this year.
• Market madness doesn’t necessarily subside quickly. 2008 had 139 BMDS. Worst ever. But then 2009 had 117 …
So although this may not give any comfort about when it might end – at least you know it’s completely ok to be reeling from what’s going on. It is also important to remain in a well diversified portfolio and being invested in multi-asset funds can soften the impact of such big swings in equity prices.